Enhancing Health with Indoor Air
Compiled by Brian Gilligan, PE, GSA's Office of Federal High-Performance Buildings, and the Wellbuilt for Wellbeing Project Team
Why is indoor air important?
Americans spend 90% of their time indoors, so the quality of our indoor air is critical to our health, comfort and performance. Building systems help keep indoor air clean so that we do not get sick from exposure to toxins but more than that should help us stay well, energized, and productive. Recent studies suggest that improving indoor air quality beyond what conventional design requires could reduce rates of absenteeism, inflammation, infection and other symptoms of sick building syndrome by over a third and improve cognitive performance by as much as half. Perhaps there is an opportunity to help people feel healthier and perform better for having been in our buildings.
How might we improve Indoor Air?
There are four key levers to enhance human health, comfort, and performance by improving indoor air. Click each lever below to see specific actions and measurable environmental outcomes.
Building design is an evolving field but it is not always clear where it is best to go beyond convention as there is a balance to be found between the energy associated with heating, cooling and ventilating a space, and the ways in which doing so can elevate the human experience. Evidence-based practice can offer guidance and provide justification for doing so. Current standards for the indoor environment were developed by OSHA and ASHRAE, and they are convention for good reason. They are widely understood and reliably provide safe environments with a predictable level of occupant satisfaction. However, design teams increasingly recognize opportunities not just to protect occupants from acute threats, but also to take an intentional approach to creating superior workplaces. One can see layers of tools and approaches that build on the conventional approach of protecting workers from acute risks and promoting thermal comfort and avoiding occupant complaints. These tools and approaches began with recognizing leadership relative to prevailing codes and standards and have expanded more and more to establishing stringent, research-based standards focused on occupant health and well-being. All of these tools recognize the value of the “Four Levers” in improving workplace health, comfort, and performance.
Lever 1 - Provide More Fresh Air and Deliver it to the Breathing Zone
Ventilation systems supply filtered outdoor air to keep indoor air clean and odor-free. They prevent the pollutants that people and their work bring with them from accumulating to unpleasant or unhealthy levels. Building systems are mostly designed to bring in a set minimum amount of outdoor air. Minimum outdoor air rates are most often set by ASHRAE Standard 62 . The Standard considers the size of a building, its intended use, and the number of people expected to be in it. For office spaces it was developed from survey feedback regarding odors or complaints about the “bioeffluents” emitted by people. Under this “conventional” system, an office with 200 square feet for each person requires at least 17 cubic feet of outdoor air per minute per person (CFM/Person).
After the pandemic, ASHRAE released its Standard 241 for Control of Infectious Aerosols. It defines an increased “Equivalent Clean Air flow” during times of greater risk of infection. It is a flexible approach that allows building operators to meet increased requirements by providing a mix of more outdoor air, more recirculated indoor air cleaned with filtration or air cleaning technologies in the ventilation system, use of air cleaning technologies in individual spaces, and reduced occupancy. Under the standard, when agency or public health officials deem necessary, the amount of equivalent clean air in office spaces would be increased to 30 CFM/Person.
How much filtered outdoor air do existing systems suggest?
The table below identifies ventilation approaches ranging from conventional to more stringent levels.
| Standards/Systems | Minimum Ventilation Rate (@200SF/Person) | CO2 Steady State* |
Conventional:
ASHRAE 62.1, OSHA |
~17 CFM/Person
ASHRAE 62.1: 5 CFM/Person + 0.06 CFM/SF
Demand Control Ventilation not required |
1000 ppm |
Enhanced (Better):
LEED v4 / Well v2, Finnish SIAQ “Good”, Hong Kong “Excellent” |
~22 CFM/Person
LEED/WELL: ASHRAE + 30%
Demand Control Ventilation required if <40SF/Person |
850 ppm |
~27 CFM/Person
WELL (extra point): ASHRAE + 60%
Demand Control Ventilation required if <40SF/Person |
750 ppm |
Stringent (Best):
ASHRAE 241, 2016 CA Title 24 Standard, Finnish SIAQ “Individual” |
~30 CFM/Person
CA Title 24: Greater of 0.15 CFM/SF, 15 CFM/Person
Demand Control Ventilation required |
700 ppm |
*Note: The relation between ventilation and CO2 is not linear. As CO2 goes down, the same amount of ventilation removes less CO2 each minute. More airflow is needed to remove the 1 ppm of CO2 at 700ppm than at 1000 ppm.
Minimum ventilation rates are most often set by ASHRAE Standard 62. The standard considers the size of a building, its intended use, and the number of people expected to be in it. For commercial office buildings it was developed from survey feedback regarding odors or complaints about the “bioeffluents” emitted by people. Under this “conventional” system, an office with 200 square feet for each person requires at least 17 cubic feet of outdoor air per minute per person (CFM/Person).
To set the minimum rate, designers estimate the largest number of people expected to be in a space. The more people, the more contaminants will accumulate. If the number of people is stable contaminants reach a limit or “steady state” level. Removing pollutants and contaminants are addressed more in our filtration discussion but the effect can be tracked in real time by measuring carbon dioxide (CO2) levels. The CO2 level indicates whether the ventilation rate is keeping up with the people present. For a given number of people and size of space, all else being equal, a ventilation rate can be associated with a steady state amount of CO2.
Our “enhanced” systems suggest higher than conventional ventilation rates to bring in more clean outdoor air and dilute pollutants. This results in more CFM/Person of outdoor air and a lower CO2 steady state. Some systems are performance based, and specify a CO2 steady state target instead of a fixed ventilation rate. The enhanced and stringent approaches often require Demand Control to save energy when fewer people show up to a space and the higher ventilation rate is not needed to “keep up” with their presence.
How might more fresh air benefit people?
According to a significant body of research, more fresh air is better for our health. Higher ventilation rates supplying more outdoor air are associated with less absenteeism, fewer symptoms of sick building syndrome, and better performance on standardized cognitive tests. Both ventilation rates and expected CO2 levels have been used as measures for this.
Researchers at Lawrence Berkeley National Lab (LBNL) found increasing the conventional ventilation rate from 17 to 22 CFM/Person across the US (i.e. shifting from the conventional to an enhanced approach) could save $12B a year in costs associated with employee performance, absenteeism, and sick building symptoms. 22CFM/Person is roughly the rate required to earn the Enhanced Ventilation credit under the LEED rating system. The same study found that further increasing the ventilation rate to 33CFM/Person would save $38B a year.1 This is roughly what is required under the California Title 24 standard. A study of 40 buildings found that increasing ventilation to 50CFM per person reduced short term absenteeism rates by 35%2 and another study found greatly reduced symptoms of sick building syndrome at this rate.3 EPA’s Building Assessment Survey and Evaluation (BASE) study found that 20-30% fewer occupants reported SBS symptoms in study spaces with ventilation rates above 20 to 25 cfm/person, compared to study spaces with lower rates between 10 to 20 cfm/person.4 Finally, a literature review found that increased use of economizers to bring in more fresh air related to reduced absentee costs of $0.30-$0.80 per square foot.5 Many of these studies accounted for the increased energy needed to provide more fresh air. They found the savings associated with increasing ventilation was an order of magnitude larger than the increased cost of moving and conditioning outdoor air to provide it.
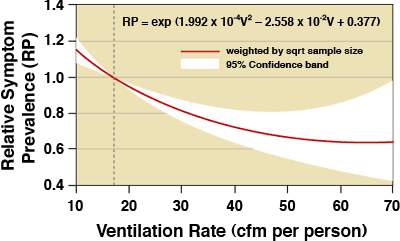
Estimated relative SBS symptom prevalence in office workers versus ventilation rate
Source: Lawrence Berkeley National Labs
The CogFX study tested performance on a rigorous cognitive assessment called the Strategic Management Survey under different air quality conditions. At 950ppm (less CO2 than expected when ventilation provides 22CFM/Person outdoor air) participants performed 15% worse than at 650ppm (slightly less than the CO2 level expected at 30CFM/Person). At 1500ppm, more CO2 than expected at the conventional ventilation rate but still frequently found in conference and other small meeting rooms, participants fared 50% worse.6 A follow on field study using the same test found participants in buildings with ventilation rates of 22CFM/Person performed 26% better than those in buildings with conventional ventilation rates of 17 CFM/Person.7 Whether CO2 is the direct driver of these conditions or a proxy for other conditions associated with ventilation rates is not supported by all studies,8,9,10 but the general relation between increased ventilation and performance is less controversial.
Though not directly related to health, wellbeing and performance in commercial office buildings several studies explored the influence of classroom air quality on the performance of children in school. One study used a literature review to review other relevant studies and developed a model based on their findings. The study found students were 12% faster at certain routine tasks and psychological tests, and 2% more accurate when CO2 was reduced from 4,100ppm to 900ppm.11,12
Once you select a minimum rate for the building, is air quality always the same?
Designers calculate a building’s ventilation rate based on the maximum number of people they expect, but the nature of indoor environments is much more dynamic. Several factors like contaminants introduced by people, outdoor pollution levels, leaky structures and facades, renovations after construction, and the approach used to distribute air within a space all affect air quality. Still, the number of people in a space can be the most dynamic factor day to day. The more people, the less effective a given ventilation rate will be at maintaining air quality and removing the “bioeffluents” and other contaminants those people bring. Carbon dioxide (CO2) can be measured to show this effect. ASHRAE 62 sets a maximum target for CO2 equal to the quantity of CO2 in outdoor air plus 700ppm. Since there is usually about 400-500ppm CO2 in outdoor air conventional ventilation rates should keep indoor CO2 below ~1,200ppm. However the dynamic factors present in the building mean that the designer’s initial calculation alone is not enough. To optimize a building’s indoor environment so that it enhances health, comfort and performance requires continuous, distributed measurement and adaptive management.
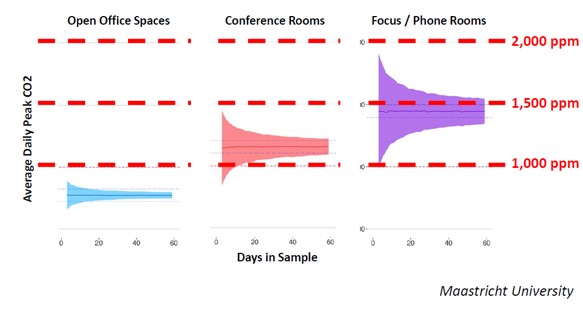
Some spaces are more dynamic than others. Large, sparsely-occupied spaces like open plan or private offices will usually stay below the design target. Small, densely-occupied spaces like conference, focus and class-rooms will vary more and frequently rise above the target. When, where and how long you measure makes a big difference.
Uncertainty over how high CO2 levels will each day differs between different space types and narrows with longer measurement
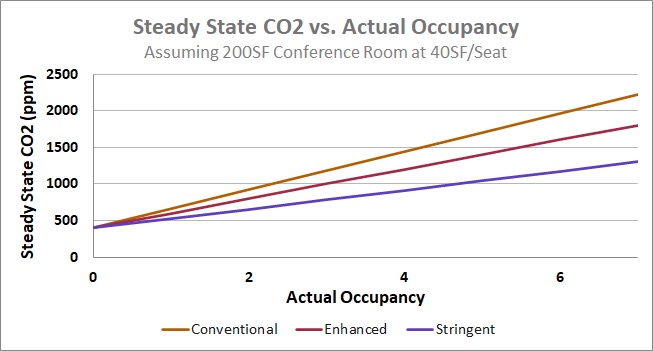
CO2 levels will rise to a steady state limit given the static ventilation rate set at design (here based on 40SF/person) and a given actual occupancy
Consider a small open-office area of 1000SF seating 5 people. With the conventional approach, this space should receive a total of 85CFM of fresh air and end up with ~600ppm CO2. Now consider a small, 200SF conference room designed for 5 people. The conventional approach would provide this room a total of 37CFM of fresh air and reach ~1750ppm CO2. This is still 5 people but the smaller space ends up with much higher CO2 than the open office. If 8 people show up to the meeting, and who hasn’t attended a meeting in a crowded room, CO2 will reach ~2,500ppm. Whether 5 or 8 people show up, Harvard’s CogFX study suggests people may be significantly impaired
You can explore the relationship between CO
2 level and occupancy here:
Design, build and operate ventilation systems understanding the factors that affect performance:
- The fresh air intake should be located away from loading docks and other pollution sources.
- Fresh air delivery risers, plenums and diffusers must be open and properly distributed to deliver fresh air effectively. ASHRAE rates the effectiveness of several different air distribution strategies. However, the performance of all such strategies are susceptible to impact from changes to floor plan or furniture. Ensure the system is regularly balanced and any floor modifications consider the air distribution strategy in your building.
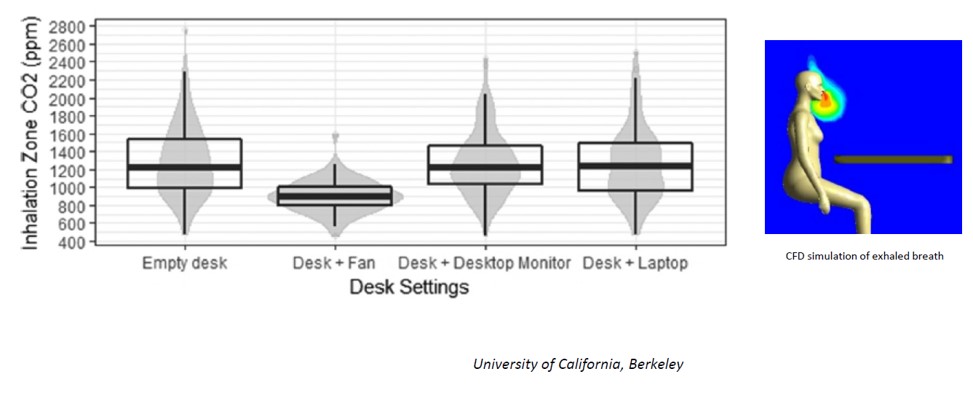
| CO2 in our “personal cloud” is 400-800ppm higher than just a few inches away from us; small, personal fans literally blow it away. |
Interestingly, researchers at the University of California, Berkeley Center for the Built Environment working with GSA’s
Wellbuilt for Wellbeing
project team found that there is a
Personal CO2 Cloud, or bubble of higher CO
2 around each of us.
13 The cloud is caused by the fluid dynamics of near-body airflows that are driven by our skin temperature. It is highly dynamic and influenced by our posture, what we are doing, what we are wearing, and the physical shape of our nasal passages. The cloud has 400-800 ppm more CO
2 than the air in the rest of the room and has elevated levels of other pollutants that shed naturally from our skin and clothing. The cloud and any related negative effects are easily dispersed by a small personal fan or by standing and walking.
13
What should we consider when designing fresh air rates for new or retrofit space?
GSA’s Total Workplace Scorecard (to be deployed summer 2020; requests can be sent to AskFMI@gsa.gov) lists a number of factors believed to contribute to improving indoor air quality and increasing the effectiveness of ventilation systems. Here are a few things to consider when designing new systems or renovating existing systems:
It is important to balance the benefits of giving people more fresh air with the cost of providing it. For example, it takes energy to heat or cool fresh outdoor air to comfortable temperatures. Several strategies can mitigate or eliminate the cost of providing fresh air. Economizers make use of “free cooling” when outside temperatures are mild and heat recovery systems pull energy out of air before it is exhausted from the building during heating and cooling seasons. Heat recovery systems extract the heat or coolth of exhausted air and transfer it to incoming fresh air when conditions are too cold or too hot. Perhaps most importantly, Demand Control Ventilation (DCV) systems provide feedback to make sure that ventilation rates are slowed when spaces are not fully occupied. This makes sure ventilation energy is used efficiently to provide benefits when people are there and save energy when they are not. CA Title 24 requires use of economizers, heat recovery systems and Demand Control Ventilation.
Conventional HVAC designs usually combine the functions of maintaining air quality with maintaining thermal comfort. Often, thermal comfort conditioning takes precedence and some times fresh air flow may be compromised in a given space. DOAS decouple ventilation from conditioning. They provide ventilation consisting of 100% outdoor air at a rate that is not dependent on the heating or cooling needs of the space. The result is a more consistent amount of outdoor air and less likelihood of over-cooling or overheating. Such systems also allow individuals to set temperatures to their personal comfort without impacting the flow of fresh air to the space. DOAS do not necessarily provide more fresh air, they provide the amount of fresh air they are designed to provide and provide it more consistently than the more common VAV systems.
It is important to note that outdoor air in polluted environments may require more filtration for DOAS to truly enhance health. Our discussion on filtration goes into more detail on this subject
Natural ventilation relies on allowing people to open windows to provide fresh air in climate zones where there are a significant number of days when conditions outside are appropriate. Some buildings make use of mechanical systems but still allow occupants to open windows to provide air at appropriate times. This can be very useful during power outages that shut mechanical systems down. So-called
“Mixed Mode” systems allow the building to use mechanical conditioning and ventilation when outdoor conditions are uncomfortable, excessively noisy, or require filtration due to local, seasonal, or contingency-driven pollution of outdoor air (e.g.,
fire, regional air quality events, local conditions). They switch to natural ventilation mode when conditions are appropriate.
Our discussion on filtration discusses this subject in more detail.
Natural ventilation and mixed mode systems have been shown to increase comfort and satisfaction. They are often assisted by less energy intensive personal fans, ceiling fans, etc to move air through the building during seasons or weather conditions where the air does not move sufficiently. Fans may increase satisfaction by giving people more control over their environment, providing more variability in conditions, and changing the range of conditions that feel comfortable to them. The term “adaptive comfort” derives from study of natural ventilation.
Learn more:
Finally, buildings with natural or mixed-mode ventilation may create indoor environments with a more “natural microbiome” than buildings that rely only on mechanical ventilation.14 Tightly-sealed, mechanically-ventilated buildings tend to reduce the diversity of microorganisms overall and favor human pathogens in particular. Similarly, natural ventilation near natural features like rivers, cascades, forests, mountains or coastal surf may introduce “negative ions” which some research suggests may reduce particulates15 and ameliorate depression.16 However, these topics are not well understood and a profusion of products claiming to provide benefits related to them are based on little or no evidence. Exercise caution when designing for these benefits.
Back to Top
Lever 2 - Remove Outdoor Pollutants
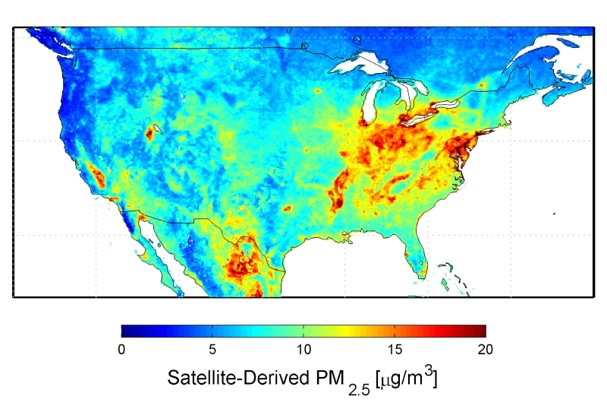
 Source: USGS, photographed by EPA
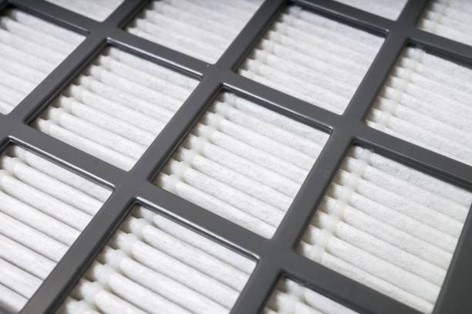
Indoor air quality is influenced by outdoor air pollutants. Of these, fine particulate matter (PM) and ozone (O3) account for much of the adverse health effects associated with air pollution. Importantly, most of our exposure to these pollutants actually occurs where they are brought indoors.17 Most commercial office buildings use filters to remove PM from outdoor air and some, though many fewer, use filters with activated carbon to remove O3.
Wide ranges of outdoor air pollution can be found across the U.S. Generally, higher PM and O3 levels are found in urban areas. PM forms directly as a by-product of combustion in cars, buildings and industrial processes while O3 forms after volatile organic compounds released from these same sources go through chemical changes in the air. Periodic or seasonal events like wildfires can cause dramatic, if temporary increases across a whole region as seen in the wildfires in California in 2017 and 2018. Significant local variations can also be found due to placement of industrial facilities or major traffic arteries within a given region.
The table below provides a summary of approaches to building air filtration that help protect the indoor air we breathe from outdoor pollutants. The higher the MERV rating of a building’s filters, the more outdoor air pollution you can have and still provide good air quality indoors. Filters must be properly maintained, however, to get this benefit as dirty higher-MERV filters can actually be worse for people than clean lower-MERV filters. Outdoor air infiltration can also be reduced by using building systems to maintain positive pressure conditions. This can reduce PM infiltration through the building envelope.
How much filtration do existing approaches suggest?
| Outdoor Pollutant Levels | Conventional "Good" Indoor Levels | Enhanced "Better"
Indoor Levels | Stringent "Best"
Indoor Levels |
PM2.5
If outdoor 8-Hour average levels are: |
Prescriptive: MERV 8
Removes ~30% of PM
ASHRAE 62 |
Prescriptive: MERV 13
Removes ~60% of PM
LEED v4 / Well v2 |
Performance: Stay below 12-15 μg/m3
RESET High / Well v2 |
0 - 20 μg/m3 *
Most U.S. urban areas in typical pollution conditions |
0 - 14 μg/m3 |
0 - 8 μg/m3 |
<12-15 μg/m3
or 75% less than outdoors |
20 - 50 μg/m3 *
U.S. urban areas in peak pollution conditions |
14 - 35 μg/m3 |
6 - 20 μg/m3 |
<12-15 μg/m3
or 75% less than outdoors |
50 - 100+ μg/m3 *
Some overseas urban, extreme events |
35 - 90+ μg/m3 |
20 - 40+ μg/m3 |
<12-15 μg/m3
or 75% less than outdoors |
| Expansion space |
|
Install sufficient rack space to respond to extreme events
Well v2 |
|
| Ozone & VOCs |
No benefit |
Activated Carbon
Removal of ozone / VOCs
Well v2 |
Activated Carbon
Removal of ozone / VOCs
Well v2 |
| Airborne Pathogens |
No benefit |
Ultraviolet
Germicidal irradiation
Sanitizes air of pathogens
Well v2 |
Ultraviolet
Germicidal irradiation
Sanitizes air of pathogens
Well v2 |
*Note: This table considers the indoor environment that different approaches to filtration provide. RED text means NAAQS 8 hour average standards of 35 μg/m3 are not met indoors. Yellow means NAAQS 8 hour average is met but RESET High Performance 8 hour average is not. Black means both are met.
Under the Clean Air Act, U.S. outdoor air quality and pollutant levels are monitored by the EPA using a network of high-quality meters in each county across the country. The National Ambient Air Quality Standards (NAAQS) capture the pollutant levels for 6 “criteria pollutants” including PM and O3 which require action if exceeded. NAAQS limits PM to an annual average below 12 μg/m3 and a daily average below 35 μg/m3 for PM, and it limits O2 to an 8-hour average below .07 ppm. In locations exceeding these limits, building filtration could maintain air quality within NAAQS. However, indoor air quality standards are not usually designed for this.
Indoor air quality standards are designed to protect against toxic effects of contaminants like asbestos, carbon monoxide and mold. ASHRAE’s Standard 62, referenced by many local buildings codes, requires a minimum filtration level to protect HVAC components from fouling. While these approaches do offer some protection from chronic effects, evolving building rating systems like LEED v4 and WELL v2 offer credits designed specifically to reduce them. The RESET Air for Commercial Interiors “High Performance” (RESET High) system goes further by establishing targets for indoor pollutant levels.
How might more filtration and less indoor pollution benefit our health?
Enhanced and stringent approaches to filtration will result in better indoor air quality. Approaches that provide some flexibility to prescriptive requirements or that are performance-based may also save energy while providing those health benefits.
PM, especially ultrafine particles smaller than 2.5 microns in diameter (PM2.5), contribute to long-term chronic conditions like heart and respiratory disease, stroke, cognitive decline, and lung cancer.18 Reducing peak levels of PM can also immediately reduce acute symptoms like inflammation and irritation of airways. While the World Health Organization (WHO) says that no level of PM is risk-free it suggests a target of 10 μg/m3 over 8 hours for all regions to avoid the worst health risks. This WHO threshold is similar to the NAAQS annual level 12 μg/m3 over 8 hours.
According to the Global Burden of Disease 2010 study, PM is responsible for more than 3 million premature deaths each year. As such, the chronic effects of particulate pollution were found to be more lethal than epidemics of malaria or AIDS at the time. Most of these effects were related to pollution in the growing urban areas of Asia and Africa. However, a recent study found that reducing PM to the WHO target in the relatively cleaner conditions found in most of the developed world could save a half million lives per year.18 Moving from conventional to enhanced or stringent filtration in U.S. office buildings where local or peak conditions exceed the WHO threshold would achieve this goal.
Breathing ozone can trigger a similar variety of short term, acute health problems including chest pain, coughing, and irritation and inflammation of airways. These effects worsen chronic conditions like bronchitis, emphysema, and asthma. While the effects of O3 are generally short-term, long-term exposure can also damage lung tissue increasing medical costs and reducing lung function over time.
In the US, particulate filters are described by the Minimum Efficiency Reporting Value (MERV) which measures the percentage of particles a filter can remove from the air. As with ventilation rates, the MERV level for a building is set to a minimum level by local building code. In the US, this most often refers to ASHRAE 62 which requires a minimum of MERV 8 to avoid pollutants fouling mechanical equipment. A higher MERV rating will remove more pollutants resulting in better indoor air quality. The WELL Standard v2 and LEED v4 provide points for increasing filtration to MERV 13.
Filters containing activated carbon have been shown to be effective at removing ozone.19 Carbon filtration is much less common than particulate filters and are typically added as additional pre-filters on building air intakes. Carbon filters can be normal fibrous filters with activated carbon added to them or granular beds of activated carbon. The WELL Standard v2 offers points for carbon filters.
Conventional design approaches are often prescriptive in nature and view filters as static. They provide the same level of filtration at all times regardless of actual pollutant levels. The only dynamic is that filters be cleaned or replaced as needed
Designers could base filter selection on expected levels of outdoor air pollution. Considering local air quality data, the MERV rating could be sized to ensure that indoor air levels meet NAAQS or RESET High standards under normal conditions. Further, the WELL Standard v2 suggests that the filter rack should be designed to allow space for additional filters, filters with higher MERV rating, or activated carbon filtration when such need arises. With that spare capacity, filtration can be added as needed if outdoor conditions change due to seasonal variation or other unplanned contingency like wildfires.
Indoor Environmental Quality (IEQ) sensing can be used to determine how human activities influence air quality (e.g., opening the windows). If a dense grid of appropriate sensors is deployed it could show how people use buildings, including how natural ventilation is well used or under utilized. Beyond understanding air quality through CO2, PM, CO, NOX, and VOCs, evaluating measurements of multiple IEQ factors could help to understand whether the intent of the building or building systems design is achieving the desired result. Learn more in the Human Impacts section and Buildings and Health module.
Like increasing ventilation rate, adding filtration requires more energy to move air. Creating flexibility to scale filtration to the level and type of outdoor pollution allows building operators to save energy when high levels of filtration are not needed and invest energy in protecting occupants when they are.
-
-
- The EPA provides data at the county level showing where air quality fails to meet Clean Air Act NAAQS. Buildings in these counties are in greater need of providing protection to occupants generally. The data is collected by a network of high-quality, reference-grade air quality meters. However, large inter-regional variation can occur. Pollution levels can be significantly higher in specific parts of a city or region (e.g. those near transportation hubs and corridors, factories, power plants, etc.) than others. There is data available to owners and designers on this subject. The EPA has made access to a voluntary network of additional meters through its Real Time Geospatial Data Viewer (RETIGO). Bloomberg offers this map of pollutant levels in metro centers around the world. Also, the World Green Building Council welcomes organizations to purchase and deploy outdoor air quality monitors and share data through their Plant a Sensor campaign. These resources allow designers and operators to benefit from and contribute to a better understanding of hyper-local outdoor air quality conditions.
-
- Maintaining positive pressure in the building will reduce infiltration of outdoor air pollutants through leaky building facades and around leaky windows and doors.
- Designers should avoid placing building air intakes near sources of pollution like street-level near traffic, near exhaust vents from kitchens or building furnaces. These bring pollution into the building and degrade filters more quickly.
- Consider also what opportunities there are to create green buffers between outdoor pollutant sources and the building (e.g., trees, green walls, similar landscaping). These create interest and appealing space for physical activity while separating pollutants from entrance through air intakes or infiltration.
- Increasing filtration level can require tradeoffs in some, especially older, existing buildings. Increased filtration may increase the strain on fans to push the same amount of air through them. This requires an increase in fan speed or less air will be delivered to the indoor spaces. Where fans are constant speed or undersized there will be less fresh air delivered to spaces, and, there will be an increase in maintenance requirements for the fans. More expensive filters that do not create as much resistance to air flow despite the greater filtration should be used where fan speed is an issue.
Back to Top
Lever 3 - Manage Thermal Conditions
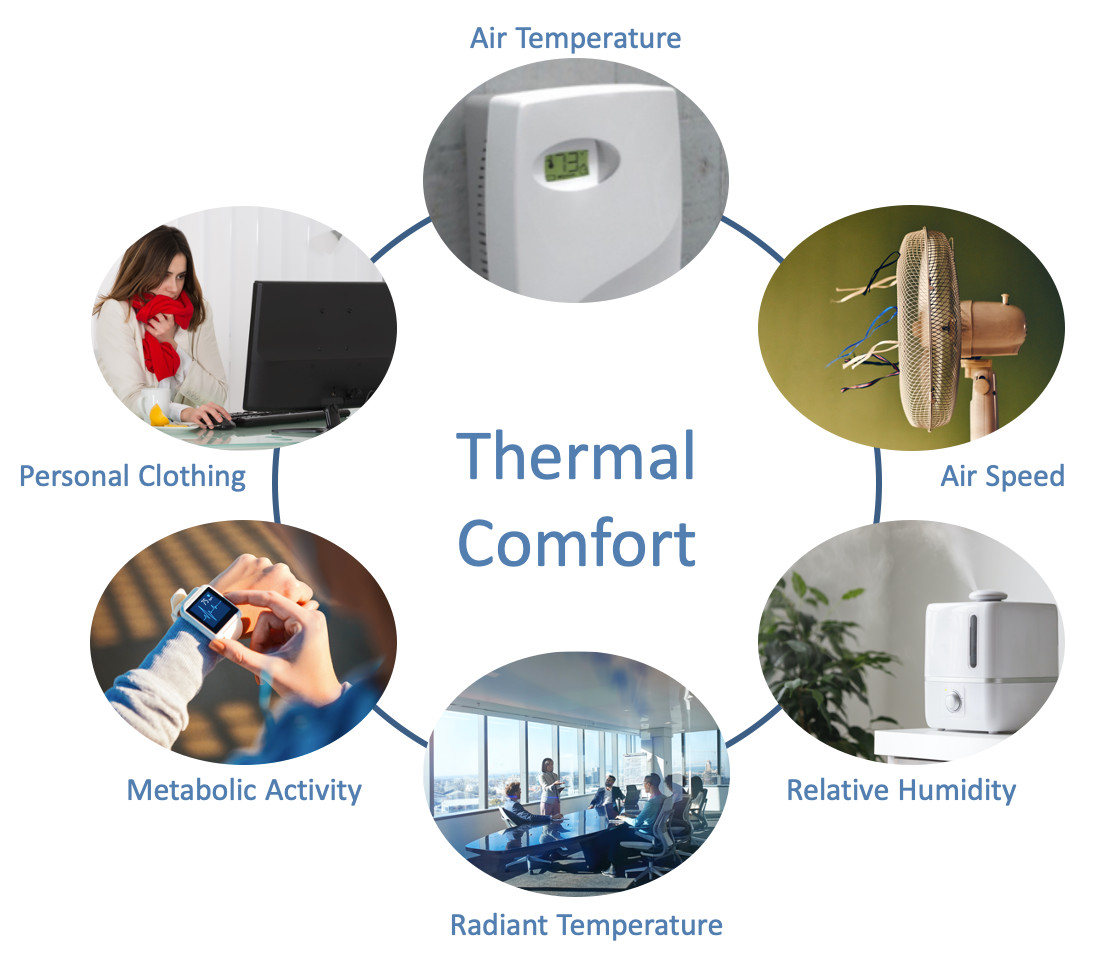
Thermal conditions in office buildings are generally viewed from the perspective of comfort rather than health. Priority is placed on maintaining uniform conditions that can't meet the wide range of personal factors and preferences people have. While there are six factors that affect thermal comfort most buildings use only air temperature to manage indoor conditions. Perhaps we create suboptimal indoor environments by avoiding variation and ignoring the influence of other factors like humidity on health. The limitations to our conventional approach are evident in the fact that ASHRAE 55 standard for thermal comfort accepts as success receiving complaints from 1 in 5 occupants that conditions are too hot or too cold.
Temperature studies have found that performance of office work tasks is maximized when air temperature is approximately between 70 °F to 73 °F, with a peak at 71°F. As indoor air temperatures fluctuate from this range, estimates put performance decreases at 0.37% and 0.43% per each degree decrease or increase, respectfully.20
After temperature, humidity has the most significant impact on health and performance. However, it has little direct impact on results in comfort surveys. Human beings have no direct ability to sense RH and perceive it instead as discomfort with temperature or as “stuffy” air. While high-humidity leads to significant, often visible, mold and other microbial growth, dry air’s issues are generally unfelt and unseen. For this reason, lower bounds for RH have been gradually removed from ASHRAE standards for comfort and ventilation. Poor experience with humidification in older building system designs has made many designers wary of actively addressing dry air. However, improved design and equipment and an emerging body of research supports testing methods to tighten control of RH around an optimal range.
| Approach | RH Range
(at ~72°F) | Environmental / Health Outcome |
Conventional (Good):
ASHRAE 62
ASHRAE 55 |
Maintain <60% RH |
Mold and microbial growth are prevented avoiding serious acute and long-term health impacts
Dry air driven by weather and indoor heating:
- PM counts, infectious droplet size, and the time both remain in air increase as RH drops below 40%
- Inflammation of eyes, skin and airways, greater sensitivity to PM and VOCs, and greater susceptibility to infection occur in minutes of RH below 40%
- Dehydration, fatigue and loss of focus begin to affect people over a few hours of RH below 40%
|
Enhanced (Better):
Illinois IDPH |
Maintain 20%-60% RH |
Dry air varies with weather but avoids extremes:
- PM counts are reduced, smaller infectious droplets, and the time both remain in air is less
- Inflammation, dehydration and related effects still occur but the impacts are less severe and frequent
- Care must be taken to avoid condensation within the building envelope in cold climates or during colder conditions
|
Stringent (Best):
ASHRAE Japan (Healthcare) |
Maintain 40%-60% RH |
RH maintained within a tight range:
- Less PM and potentially less filtration needed to maintain air quality
- RH does not drive inflammation or dehydration
- Reduced risk of infection from pathogens
- Care must be taken to avoid condensation within the building envelope in cold climates or during very cold conditions
|
If there is an optimal range for temperature, is there also an optimal range for RH?
A growing body of research has found evidence of an optimal range for RH between 40-60%. Researchers with GSA, the University of Arizona and Baylor College of Medicine found higher stress and poorer sleep quality outside this range.21 While the impacts of high indoor RH are accepted and often visible, low RH or dry air is increasingly seen as important as well.
Typical impacts of dry air include:
Increased humidity may reduce the quantity or count of particles suspended in indoor air. This is a complex phenomenon that is influenced by the size, shape and hygroscopy of the particles themselves which vary. Studies have shown conflicting results but water absorbing particles tend to spend longer in the air in dry conditions and be more easily resuspended by traffic in low RH.22,23
Dry air degrades the eye’s tear film and mucous membranes in skin and airways making them more susceptible to inflammation22,23,24 and infection.25 Additionally, dry air has been associated with increased production of the inflammatory stress hormone cortisol in skin.26 Dry air has been shown to break down precorneal tear film (PTF) in as little as an hour causing cascading inflammatory effects; the formation of dry spots also makes the eyes more susceptible to inflammatory effects of common air pollutants including particulate matter and oxidants like ozone.24,27 Hydration from increased RH or moist inserts on glasses worn by patients with dry eyes relieved these symptoms.28 Dessication of nasal mucosal membranes by cold dry air causes increased release of inflammatory mediators making particulate matter more likely to adhere to surface cells.25
While the mechanisms are complex and not fully understood, cold, dry air conditions may increase the risk of transmission of certain viruses including the influenza virus in three ways.22,29,30 First, dried airways in the nose and upper respiratory tracts are more susceptible.25 Second, dry air may allow influenza virus to survive longer in the air.29,31,32 Third, increased humidity larger droplets that may carry influenza to evaporate more slowly and remain large.30 The larger particles settle out of air faster and become less likely to be later resuspended in the air by movement in the space.22,33
Dry air contributes to dehydration through “insensate” water loss or direct transfer of water from the skin to the air; dehydration persisting several hours is common to office workers and leads to fatigue, impaired visual focus, and reduced concentration.34,35 Additionally, chronic dehydration can lead to degradation of the immune system.31
How can we manage thermal conditions to improve occupant health?
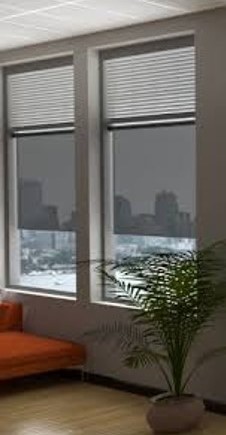 We can improve the building envelope to reduce uncomfortable conditions shown to affect performance. Eliminate hot or cold walls and windows by improving insulation, reduce direct solar gain through windows with appropriate shading and Solar Heat Gain Coefficient (SHGC), and eliminating drafts around windows and doors.
We can actively manage RH, provide greater individual control and choice in temperature, and monitor room-level conditions to prompt behavioral interventions.
Radiant heating and cooling strategies could spur energy savings by enabling a wider range of indoor air temperatures, passive humidification during heating operations,36 and desiccant dehumidification during cooling operations.37 Active hydration or humidification of air should be considered in locations where seasonal dry air do not allow for passive humidification especially in winter in temperate locations.
Radiant heating and cooling should be considered in the course of building design and maintenance to:
- Avoid unwanted asymmetric thermal radiation. Assess mean radiant temperature (MRT) of indoor spaces to identify hot and cold surfaces especially near the building perimeter. CMU’s CBPD identified that window quality, especially the number of panes of glass, and building insulation are strong indicators of thermal comfort.38
- Evaluate the effects of perimeter cooling or heating on occupant comfort. Exposure to the flow of air from perimeter systems can lead to significant discomfort. Signs include makeshift devices installed by occupants to divert or block such airflow and occupant use of personal heaters or fans. Investments in higher-quality windows and treatments to reduce solar gain may be better solutions.
- Consider whether radiant heating and cooling may provide some or all of interior conditioning. Radiant heating and cooling combined with effective control strategies promise improved comfort at lower energy cost. The process is more efficient because energy can be moved more easily through warm or cool water in pipes than conditioned air through a network of ducts; the lower setpoint and more efficient energy transfer save energy. Additionally, use of radiant heat in winter make it easier to maintain relative humidity above 30% by allowing lower indoor air temperatures especially when combined with adiabatic humidification.39
A wider range of indoor air operating temperatures within a given building could allow radiant strategies to save energy and also improve comfort for those that traditional design leave most dissatisfied. Occupants should be given the freedom to choose their workspace based on comfort or have access to personal comfort devices and greater direct control of temperature at the workspace.40
Personal preferences, clothing choice, and physiology make it very hard to please everyone. Providing increased choice and variation in conditions may address this. Consider increasing the number of thermostats to give occupants greater control of temperature in smaller areas, and creating areas with different temperatures to allow folks to choose the workplace that best fits their preferences. UC Berkeley and Carnegie Mellon University, among others, have conducted extensive research on how to achieve greater levels of satisfaction with the work environment.
In traditional designs, temperature is controlled by thermostats which measure air temperature in a specific thermal zone and call for heating or cooling based on a target or setpoint air temperature. Thermal zones can be large, e.g., an entire floor of a building affecting many people, or small, such as individual offices or conference rooms affecting a few.
There are many strategies about how much control to give occupants including full, partial, or no control. CMU’s Center for Building Performance and Diagnostics found that smaller zone sizes and greater degree of actual control lead to higher levels of satisfaction. (They may also reduce energy use, as larger spaces often are over-conditioned when sparsely occupied.) Other studies have indicated that uncomfortable temperatures can lead to reduced work performance.41 Strategies which allow greater individual control are important to consider:
- Create small thermal zones with some degree of direct, individual control to improve occupant satisfaction and work performance.38
- Provide UL-listed comfort devices like fans, foot warmers, heated chairs, etc. to provide individual microclimate control and adjust thermostat setpoints to allow a wider range and greater fluctuation of air temperatures to save energy.42
- Program for some variation in conditions within buildings such as reliably warmer or cooler spaces and transitional spaces which mimic outdoor conditions more closely.
Air speed should be considered during design and building maintenance to:
- Eliminate unwanted drafts. CMU’s CBPD found that the quality of windows adjacent to a space are an important indicator of satisfaction. Drafty windows create uncomfortable air movement during both cold and hot weather.38
- Evaluate the effects of perimeter cooling or heating on occupant comfort. Exposure to the flow of air from perimeter systems can lead to significant discomfort. Signs include makeshift devices installed by occupants to divert or block such airflow and occupant use of personal heaters or fans. Investments in higher-quality windows and treatments to reduce solar gain may be better solutions.
- Improve air distribution and circulation provided by ventilation systems by increasing the number of supply air diffusers across a space. CMU’s CBPD found that more diffusers, especially for supply air, related to improved occupant satisfaction with air quality and thermal comfort. Fewer diffusers increase the chances of dead spots, and localized unwanted drafts. Improved circulation will reduce concentration of contaminants that can affect work performance and long-term chronic stress.
- Consider using fans to allow individuals to modulate air movement as suggested by enhanced psychrometric strategies. The flow of cool, dry air increases comfort in higher temperatures allowing higher setpoints during the cooling season. Recent studies also indicate that increased airflow may dissipate a “personal envelope” of air created by near-body airflows during relatively sedentary office work.
- Employ overhead fans to create room-level air flow
- Provide personal desk-top fans to create individually-controlled air flow
- Consider natural ventilation strategies in climates and sites that support it. Under the right conditions, natural ventilation can save energy when outdoor conditions complement comfort but during hot, humid or cold weather this benefit may be negated. Opening windows can dramatically reduce buildup of CO2 and other internally generated contaminants in small spaces like conference rooms. However, in polluted locations open windows can allow the introduction of contaminants from the outdoors. Finally, these strategies introduce air movement and the variable breezes afforded have an important biophilic benefit that can enhance comfort and satisfaction.
Distributed sensor networks could be provided in workplaces and used to prompt individuals to take restorative actions, such as micro breaks, that reduce fatigue and irritation to the human eye caused by dry air. These networks could also help building operators improve thermal comfort through more active controls over temperature and humidity.21 These strategies are not new but they have been narrowly applied in practice.
The prevalence of personal devices and the internet of things provide an opportunity to give feedback in personalized ways. Our devices already prompt us to be more active if we’ve been inactive. Perhaps they could prompt microbreaks to reduce eye strain and dry eyes when our computer notes we’ve been working uninterrupted for a long time and the building knows the air is dry. Perhaps when the temperature and humidity levels are high our devices could prompt us to drink water to stay hydrated and deploy a personal fan to stay cool and disperse our CO2 Bubble if we’ve been inactive and at our seats in warm, dry air. Perhaps our temperature, sound and lighting preferences could be shared along with actual sensor measurements with a workplace reservation system so that the desk with the best set of conditions for us is suggested. All these things are coming, and gathering such data may improve our health, comfort and performance as well as our understanding of how our levers drive those things.
Back to Top
Lever 4 - Eliminate Indoor Contaminants
While outdoor air pollutants can contribute a lot to poor indoor air quality, contaminants are introduced by the things people bring into the building as well. So-called “source control” is critical to maintaining healthy indoor air and should be addressed through building design, purchasing policy and educating building occupants on the impacts of their behavior. Source control is especially important in avoiding concentrations of Volatile Organic Compounds (VOCs) which are often introduced by new furnishings, construction and renovation activities, administrative processes including cleaning and print/copy activities, personal items like food, disinfectant and other aerosols, poor hygiene, and personal care products. Particulate matter (PM) contaminants are also introduced through ventilation, infiltration, and occupant movement and activity.
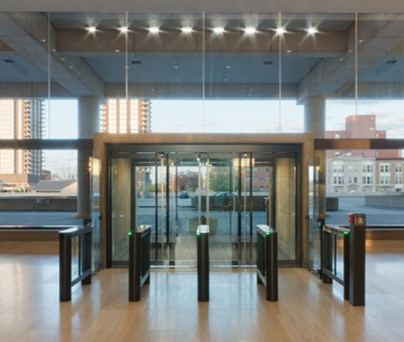
There are many source control strategies to avoid introducing contaminants in buildings. Entryway dirt capture systems serve to isolate contaminants that would otherwise be carried into the interior space, leading to decreased IAQ, cosmetic damage, and excessive maintenance resources. Dust and dirt carried into buildings on people’s footwear contains pesticide and insecticide residues, mold spores, and other contaminants of concern. An entryway dirt capture or walk-off system (such as long mats or floor grates) at exterior doors collects particulates that would otherwise be inhaled by occupants or need to be cleaned by custodial staff. Open doors and windows also bring polluted outdoor conditions inside (i.e. polluted city air, particulates from natural disasters such as wildfires, or fumes from routine landscaping) directly exposing occupants to higher levels of PM, CO, NOX, VOCs, and other potentially harmful pollutants. Simply leaving an entry door shut, ensuring it’s well-sealed, or even installing a revolving door can reduce the infiltration of these pollutants (as well as reduce building operation costs). Standards in LEED, WELL, and the Business and Institutional Furniture Manufacturer's Association (BIFMA) Level certification systems all contain guidance for selecting materials and furnishings that do not “off-gas” or release VOCs into indoor air over time.
The majority of ventilation systems in commercial buildings do not provide 100% outdoor air. Many supply the minimum amount of fresh outdoor air required by building code. That amount of outdoor air is not enough to maintain comfortable temperatures inside the building so the outdoor air is mixed with conditioned air brought back from occupied spaces. This “return air,” or “recirculated air,” allows the system to save energy on heating and cooling outdoor air. Particulate contaminants can be removed by filters on the return air system (if there are filters) but VOCs introduced indoors must be flushed out by fresh outdoor air over time. Avoiding contamination through source control is important; increasing fresh air supply is also.
In the event of a large indoor contamination (such as a renovation or some unplanned incident) there are several tools that can be used to remove contaminants. Flushing the indoor environment with a large amount of outdoor air, temporarily placing more filtration on return air branches, and extending the hours of HVAC operation can all be effective. IAQ measurements meeting RESET Air Standards could be taken before and after this process to show whether clean air conditions have been achieved.
Back to Top
Acknowledgements
GSA wishes to thank the following contributors for their input to the Wellbuilt for Wellbeing project:
- Seema Bhangar, Ph.D., WeWork, Inc.
- Alyse Falconer, PE, Point Energy Innovations
- Traci Hanegan, PE, ASHRAE Fellow, Coffman Engineers, Inc.
- Kevin Keene, LEED-AP, Pacific Northwest National Laboratory
- Luke Leung, PE, LEED Fellow, Skidmore, Owings and Merrill, LLP
- Casey Lindberg, Ph.D., HKS Inc.
- Vivian Loftness, FAIA, Carnegie Mellon University
- Forrest Meggers, Ph.D., Princeton University
- Shona O’Dea, WELL-AP, RESET AP, DLR Group, Inc.
- Jovan Pantelic, Ph.D., University of California at Berkeley
- Chris Pyke, Ph.D., LEED Fellow, ArcSkoru
- Z Smith, FAIA, Eskew+Dumez+Ripple, APC
- Stephanie Taylor, M.D., Taylor Healthcare Consulting
- Nora Wang, Ph.D.. Pacific Northwest National Laboratory
References
1 Fisk, W.J., D. Black, & G. Brunner. (2011). Benefits and Costs of Improved IEQ in U.S. Offices. Indoor Air, 21(3):357-367. 2 Milton, D.K., P.M. Glencross, & M.D. Walters. (2000). Risk of Sick Leave Associated with Outdoor Air Supply Rate, Humidification, and Occupant Complaints. Indoor Air, 10(4):212-221. 3 Sundell, J. H. Levin, W.W. Nazaroff, W.S. Cain, W.J. Fisk, D.T. Grimsrud, F. Gyntelberg, Y. Li, A.K. Persily, A. C. Pickering, J.M. Samet, J.D. Spengler, S.T. Taylor, & C.T. Weschler. (2011). Ventilation Rates and Health: Multidisciplinary Review of Scientific Literature. Indoor Air, 21(3):191-204. 4 EPA | Indoor Air Quality 5 Fisk, W.J., O. Seppanen, D. Faulkner, & J. Huang. (2003). Economizer System Cost Effectiveness: Accounting for the Influence of Ventilation Rate on Sick Leave. Healthy Buildings Conference, Singapore. 6 Allen, J.G., P. MacNaughton, U. Satish, S. Santanam, J. Vallarino, J.D. Spengler. (2016). Associations of Cognitive Function Scores with Carbon Dioxide, Ventilation, and Volatile Organic Compound Exposures in Office Workers: A Controlled Exposure Study of Green and Conventional Office Environments. Environmental Health Perspectives, 124(6). 7 MacNaughton, P., U. Satish, J. Guillermo Cedeno Laurent, S. Flanigan, J. Vallarino, B. Coull, & J.D. Spengler, & J.G. Allen. (2017).The Impact of Working in a Green Certified Building on Cognitive Function and Health. Building and Environment, 114:178-186. 8 Scully, R.R. M. Basner, J. Nasrini, C. Lam, E. Hermosillo, R.C. Gur, T. Moore, D.J. Alexander, U. Satish, & V.E. Ryder. (2019).Effects of Acute Exposures to Carbon Dioxide on Decision Making and Cognition in Astronaut-like Subjects. npj Microgravity, 5:17. 9 National Research Council. (2007). Emergency and Continuous Exposure Guidance Levels for Selected Submarine Contaminants: Volume 1. The National Academies Press, Washington, DC. 10 Zhang, X., P. Wargocki, & Z. Lian. (2016). Human Responses to Carbon Dioxide, A Follow-up Study at Recommended Exposure Limits in Non-Industrial Environments. Building and Environment, 100:162-171. 11 Wargocki, P. J.A. Porras-Salazar. S. Contreras-Espinoza, & W. Bahnfleth. (2020). The Relationships Between Classroom Air Quality and Children’s Performance in School. Building and Environment, 173:106749. 12 Stafford, T. M. (2015). Indoor Air Quality and Academic Performance. Journal of Environmental Economics and Management, 70:34–50. 13 Pantelic, J., L. Shichao, L. Pistore, D. Licina, M. Vannucci, S. Sadrizadeh, A. Ghahramani, B. Gilligan, E. Sternberg, K. Kampschroer, & S. Schiavon. (2019). Personal CO2 Cloud: Laboratory Measurements of Metabolic CO2 Inhalation Zone Concentration and Dispersion in a Typical Office Desk Setting. Journal of Exposure Science & Environmental Epidemiology, 30(4). 14 Kembel, S., E. Jones, J. Kline, D. Northcutt, J. Stenson, A.M. Womack, B.J.M. Bohannan, G.Z. Brown, & J.L. Green. (2012). Architectural Design Influences the Diversity and Structure of the Built Environment Microbiome. ISME J 6:1469–1479. 15 Jiang, S.-Y., A. Ma, & S. Ramachandran. (2018). Negative Air Ions and Their Effects on Human Health and Air Quality Improvement. International Journal of Molecular Sciences, 19(10):2966. 16 Perez, V., D.D. Alexander, & W.H. Bailey. (2013). Air Ions and Mood Outcomes: A Review and Meta-analysis. BMC Psychiatry, 13(29). 17 Zhao, D., P. Azimi, & B. Stephens. (2015). Evaluating the Long-Term Health and Economic Impacts of Central Residential Air Filtration for Reducing Premature Mortality Associated with Indoor Fine Particulate Matter (PM2.5) of Outdoor Origin. International Journal of Environmental Research and Public Health, 12(7):8448-8479. 18 Apte, J. & P. Pant. (2019). Toward Cleaner Air for a Billion Indians. PNAS, 116(22):10614-10616. 19 Fisk, W.J., M. Spears, D. Sullivan, & M. Mendell. (2009). Ozone Removal by Filters Containing Activated Carbon: A Pilot Study. Healthy Buildings Conference, Syracuse, New York. 20 DOE LBL | IAQ Scientific Findings Resource Bank - Temperature and Office Work Performance. 5th International Conference on Cold Climate Heating, Ventilating and Air Conditioning. 21 Razjouyan, J., H. Lee, B. Gilligan, et al. (2020). Wellbuilt for Wellbeing: Controlling Relative Humidity in the Workplace Matters for our Health. Indoor Air, 30:167– 179. 22 Wolkoff, P. (2018). Indoor Air Humidity, Air Quality, and Health - An Overview. International Journal of Hygiene and Environmental Health, 221(3):376-390. 23 Wolkoff, P. (2018). The Mystery of Dry Indoor Air - An Overview. Environmental International, 121(2). 24 Wolkoff, P. (2017). External Eye Symptoms in Indoor Environments. Indoor Air, 27:246-260. 25 Naclerio R.M., J. Pinto, P. Assanasen, & F.M. Baroody. (2007). Observations on the Ability of the Nose to Warm and Humidify Inspired Air. Rhinology, 45(2):102-111. 26 Zhu, G., Z. Janjetovic, & A. Slominski. (2014). On the Role of Environmental Humidity on Cortisol Production by Epidermal Keratinocytes. Experimental Dermatology, 23:15-17. 27 Huang, J-Y., P-T. Yeh, & Y-C. Hou. (2016). A Randomized, Double-blind, Placebo-controlled Study of Oral Antioxidant Supplement Therapy in Patients with Dry Eye Syndrome. Clinical Opthamology, 10:813-820. 28 Wang, M., E. Chan, L. Ea, C. Kam, Y. Lu, S.L. Misra, & J.P. Craig. (2017). Randomized Trial of Desktop Humidifier for Dry Eye Relief in Computer Users. Optometry and Vision Science, 94(11):1052-1057. 29 Noti, J.D., F.M. Blachere, C.M. McMillen, W.G. Lindsley, M.L. Kashon, D.R. Slaughter, & D.H. Beezhold. (2013). High Humidity Leads to Loss of Infectious Influenza Virus from Simulated Coughs. PLOS One 8(2): e57485. 30 Marr, L.C., J.W. Tang, J. Van Mullekom, & S.S. Lakdawala. (2019). Mechanistic Insights into the Effect of Humidity on Airborne Influenza Virus Survival, Transmission and Incidence. Journal of the Royal Society Interface, 16(150). 31 Morawska, L. (2006). Droplet Fate in Indoor Environments, or can we Prevent the Spread of Infection?. Indoor Air, 16:335-347. 32 Tang, J.W. (2009). The Effect of Environmental Parameters on the Survival of Airborne Infectious Agents. Journal of the Royal Society Interface, 6:S737–S746. 33 Qian, J., J. Peccia, & A.R. Ferro. (2014). Walking-induced Particle Resuspension in Indoor Environments. Atmospheric Environment, 89:464-481. 34 Chua S.J.L., A.S. Ali, & M.E.L. Lim. (2016). Physical Environment Comfort Impacts on Office Employee’s Performance. MATEC Web Conference, 66:00124. 35 Wyon, D.P., L. Fang, L. Lagercrantz, & P. Ole Fanger. (2006). Experimental Determination of the Limiting Criteria for Human Exposure to Low Winter Humidity Indoors (RP-1160). HVAC&R Research, 12(2):201-213. 36 Scofield, M.C., N. Deschamps, & T.S. Weaver. (2016). Variable Air Volume System Heat Recovery Economizer. ASHRAE, 58(5):34-36,38,40,42,44. 37 Rysanek, A., P. Murray, J. Pantelic, C. Miller, F. Meggers, & A. Schlueter. (2015).The Design of a Decentralized Ventilation System for an Office in Singapore: Key Findings for Future Research. Proceedings of International Conference CISBAT 2015 Future Buildings and Districts Sustainability from Nano to Urban Scale. LESO-PB, EPFL. 38 Carnegie Mellon University | Are Humans Good Sensors? Using Occupants as Sensors for Indoor Environmental Quality Assessment and for Developing Thresholds that Matter 39 Scofield,, C.M., N. Deschamps, and T.S. Weaver. (2016). Variable Air Volume SystemHeat Recovery Economizer. ASHRAE Journal, May 2016. 40 Bauman, F., H. Zhang, E. Arens, P. Raftery, C. Karmann, J. Feng, Y. Zhai, D. Dickerhoff, S. Schiavon, & X. Zhou. (2015). Advanced Integrated Systems Technology Development: Personal Comfort Systems and Radiant Slab Systems. UC Berkeley: Center for the Built Environment. 41 Seppänen, O., W.J. Fisk, and Q. Lei-Gomez. (2006). Effect of Temperature on Task Performance in Office Environment. 5th International Conference on Cold Climate Heating, Ventilating and Air Conditioning. 42 UC Berkeley CBRE | Low-Energy Occupant-Responsive HVAC Controls and Systems
Page last updated 08/31/2020
Related Topics
Adaptive Thermal Comfort
Adaptive Thermal Comfort is the theory that occupants can adapt to be comfortable at a variety of temperatures. Since comfort is based on many factors, including air speed, humidity, and temperature, adaptive thermal comfort strives to connect occupants to the outdoor world, and empower them to feel comfortable in their environments.
BuildingGreen.com | Thermal Comfort
Adequate Ventilation and Exhaust
Adequate ventilation and exhaust is important to prevent build-up of odors, carbon dioxide, allergens and toxins in indoor air. Provide separate exhaust for copy, printing, break rooms, and food preparation areas. Flush out occupied spaces prior to occupancy. Use energy efficient or variable drive fans for enhanced air movement. Consider bringing in more fresh air into the building. Ensure the building management staff is conducting preventive maintenance on all building exhaust systems (restrooms, garage exhaust fans, etc). Seal ventilation duct opening during construction or renovations to reduce dust and particle build-up.
Air Contaminants
Air contaminants are any substances in the air, particulate or gaseous, which pollute the air and make it hazardous to human health. Good indoor air quality management techniques seek to reduce the amount of contaminants in the air and protect the health of vulnerable building occupants.
Entryway Systems/Walk-off Mats
Toxins are tracked into a building on occupants’ shoes. Entryway systems, like grates, grills, and walk-off mats can greatly reduce the amount of outside dirt, dust, and particulates brought into the building. This makes for a cleaner environment, and cuts down on the amount of cleaning necessary to maintain a high level of cleanliness in the facility.
Healthy Buildings
Health, as defined by World Health Organization in its 1948 constitution, is “a state of complete physical, mental, and social well-being and not merely the absence of disease or infirmity”. This definition of health has been expanded in recent years to include (1) resilience and the ability to cope with health problems and (2) the capacity to return to an equilibrium state after health challenges.
These three health domains - physical, psychological, and social - are not mutually exclusive but rather interact to create a sense of health that changes over time and place. The challenge for building design and operations is to identify cost-effective ways to eliminate health risks while also providing positive physical, psychological, and social supports as well as coping resources.
Learn more about Buildings and Health.
Heating, Ventilating and Air Conditioning (HVAC)
Heating, ventilation, and air conditioning systems are designed to work together to maintain occupant comfort. From residential to commercial settings, HVAC systems help to keep people comfortable and healthy by maintaining good indoor air quality and comfortable temperatures.
Whole Building Design Guide | High-Performance HVAC
Outside Air
Outside air is fresh air that comes into the facility as supply air. It is mixed with air already conditioned in the space.
Replacement air
Outdoor air that is used to replace air removed from a building through an exhaust system. Replacement air may be derived from one or more of the following: makeup air, supply air, transfer air, and infiltration. However, the ultimate source of all replacement air is outdoor air. When replacement air exceeds exhaust, the result is exfiltration.
Sick Building Syndrome (SBS)
When occupants feel sick at work, but not elsewhere, they likely have SBS. SBS often manifests as cold or flu-like symptoms after breathing stale or contaminated air. It harms worker productivity and morale. It may also increase absenteeism and worker turnover. See EPA's Sick Building Syndrome Factsheet for more information.
Supply Air
Supply air is air delivered to a space by mechanical ventilation. It can be 100% outside air, or it can be a combination of outdoor air, recirculated air and / or transfer air. Although it may seem like a good idea to use 100% outside air, the air needs to be conditioned (heated or cooled) before it can be circulated, so it makes sense to use only as much as is necessary to keep the circulating air fresh and the energy use down.
Thermal Comfort
Workspaces should be designed to provide the optimum level of thermal comfort for the occupants. Occupant comfort should be based on ASHRAE Standard 55.
ASHRAE.org | Standards 62.1 and 62.2
Ventilating
Ventilating is the process of "changing" or replacing air in any space to replenish oxygen, control temperature, and remove moisture, odors, smoke, heat, dust, airborne bacteria, and carbon dioxide. Ventilation includes both the exchange of air to the outside as well as circulation of air within the building. It is one of the most important factors for maintaining acceptable indoor air quality in a building.
Ventilation
Ventilation is the process of "changing" or replacing air in any space to control temperature; remove moisture, odors, smoke, heat, dust, airborne bacteria, and carbon dioxide; and to replenish oxygen. Ventilation includes both the exchange of air to the outside as well as circulation of air within the building. It is one of the most important factors for maintaining acceptable indoor air quality in buildings.